Do more female executives mean higher ESG scores?
A growing body of research is showing that companies with more women in senior positions generate higher profits, operate more socially responsible and provide higher-quality customer experience. A recent study by the European Central Bank found that banks with more gender-diverse boards provide less credit to higher-polluting companies.
Does gender diversity also change a company’s Environment, Social and Governance (ESG) score, a metric offered to investors by different ratings providers? This analysis explores to which degree gender diversity is correlated to ESG scores by ratings providers Sustainalytics and Refinitiv. Visit the GitHub repository to review the complete code.
Background on ESG investing:
Investing strategies along specific environmental, social and governance targets have seen an unprecedented boom in recent years, with sustainable assets under management reaching US$35.3 trillion at the end of 2020, according to the latest report by the Global Sustainable Investment Alliance. That’s a staggering 36% of all professionally managed assets across the United States, Canada, Japan, Australasia and Europe.
And despite much criticism being leveled at ESG investing and its methods, goals and proposed regulations, the trend is unlikely to fade away, with more and more companies preparing ESG-related disclosures in a nod to calls by investors and other stakeholders. While a host of companies offer ESG scoring and assessments, six large providers appear to have conquered the market: Morgan Stanley Capital International (MSCI), Morningstar’s Sustainalytics, LSEG’s Refinitiv, S&P Global Ratings, FTSE Russell and Institutional Shareholder Services (ISS). Several studies have found relatively low correlation between the different providers’ scores, with an average of 0.61 compared to close to 0.99 between mainstream credit ratings from Moody’s and Standard & Poor’s.
While conventional retail investors might understand ESG ratings to measure the impact of corporate behavior on the environment and people, ratings by the six large providers in fact quantify the risks that environmental and social developments pose to the companies. While some of the ratings providers also use proprietary third party data for their ratings, they all rely on self-reported ESG data produced by companies, which some experts deem unreliable.
Background on corporate gender diversity:
The Governance portion of ESG scores usually factors in gender diversity among the executive team and board of directors, but it is unclear from the disclosures by the ratings providers how those factors are weighed.
While women college enrollment and graduation rates for years outpace those of men, the executive suites and boardrooms of U.S.-listed companies remain strongly dominated by men.
Among the roughly 3,000 companies I analyzed for this project, the distribution of the share of women across both executive and board seats is heavily skewed to the right.

That finding is in line with comprehensive gender analyses, which find that around 33% of senior management positions among North American companies were held by women in 2021.
While several studies have shown a positive correlation between women in high leadership positions and company performance, as well as corporate social responsibility, the results have been less clear for gender diversity among company boards. However, an October 2022 study by the European Central Bank showed that female board directors influence banks’ lending decisions through a climate lens - finding that “banks with a relatively high share of female directors (i.e. above 37%) display about 10% lower lending volumes towards firms with relatively high pollution intensity (i.e. last quartile of the distribution) compared to the other group of banks.”
I became intrigued to explore whether gender diversity among senior leaders at U.S.-listed companies is correlated to ESG performance. My analysis does not suggest any direct causation due an increase in female leadership, but merely seeks to explore whether there is a statistically significant correlation between ESG scores and the share of women among executives and board members.
Project Overview:
Of the six main ESG score providers listed above, only two provide scoring publicly on their websites: Sustainalytics and Refinitv.
I gathered scores from both websites for U.S. listed companies, using a list of some 7,000 company tickers publicly traded on U.S. stock exchanges. Many of the tickers belonged to ETFs or secondary listings by companies, and both Sustainalytics and Refinitiv did not provide ratings for many of the companies on the original list.
In the end, I was able to gather ESG scores for roughly 2,800 U.S.-listed companies from Refinitiv, and around 2,500 from Sustainalytics.
I then requested information on executive and board leadership gender composition by using the Finnhub Stock API. While there are many financial data API providers to choose from, finding one that provided data on senior leadership’s gender was surprisingly difficult and I was only able to find Finnhub’s. I also used Fibbhub’s API to assign industry sectors for each company.
I also downloaded revenue and employee data for the companies I analyzed through the Finnhub API, but quickly discarded revenue as a metric for my analysis as Finnhub did not provide revenue figures for a large number of companies.
Once I had my final data, I analyzed for statistical significance using R. I completed both correlation matrices, multiple linear regression analyses and box plots of the categorized data.
I then also visualized the findings in Tableau, including a regression line that allows users to read out correlation coefficients.
Tools Used:
Jupyter Notebook,
Python / Pandas,
Selenium / Chrome WebDriver Manager,
BeautifulSoup,
Excel,
Finnhub Stock API,
Matplotlib,
RStudio and R,
ggplot,
Tableau
Project Findings:
Refinitiv and Sustainalytics use different methods to score ESG risks.
Refinitiv scores ESG performance on a sliding scale from 0 to 100, with higher scores indicating better ESG performance.
For more details visit the Refinitiv methodology page.
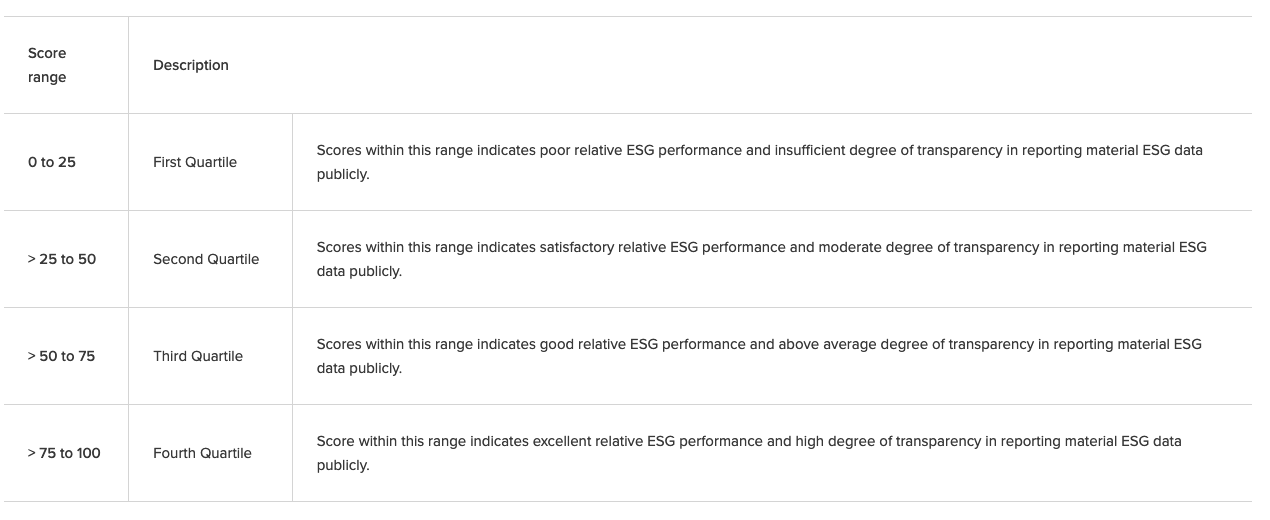
Sustainalytics instead scores companies on a sliding scale from 0 to 40+ according to risk, with a lower score indicating better ESG performance. For more details visit the Sustainalytics methodology page.

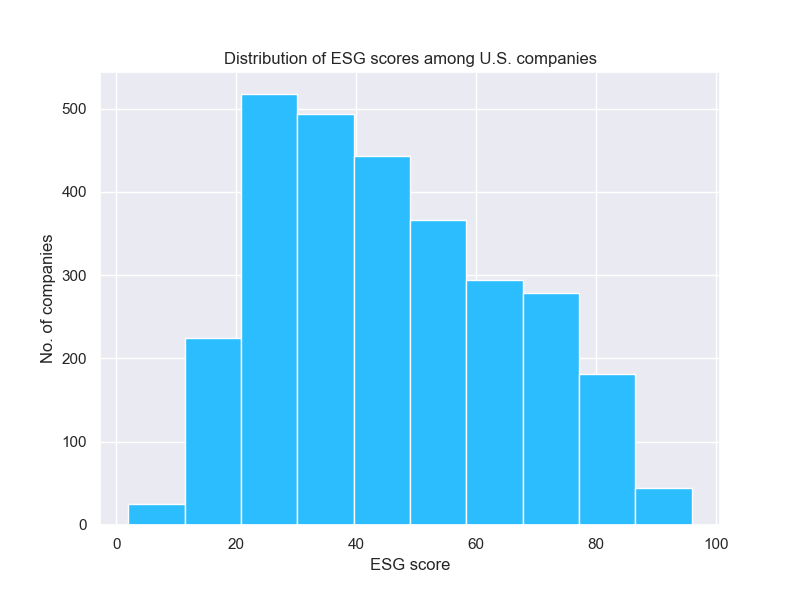
From the thousands of companies I analyzed through both ESG score providers, score distributions differed:
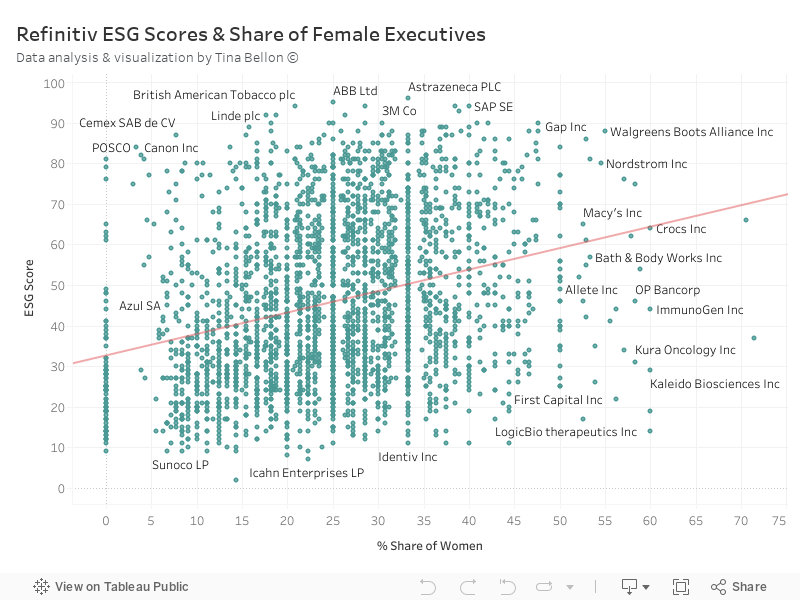
For Refinitiv, the median company ESG Score is 43, a score indicating ‘satisfactory relative ESG performance,’ according to Refinitiv.
For Sustainalytics, the median ESG Risk Score is 25.35, a value the company considers a medium ESG risk.
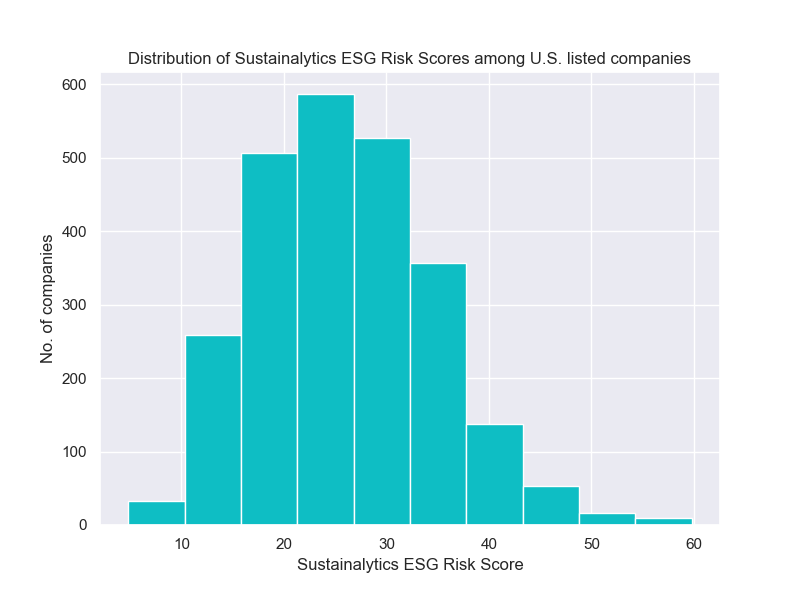
While the Sustainalytics scores are closer to a normalized distribution, the Refinitiv ones skew to the right.
Now what about the women?
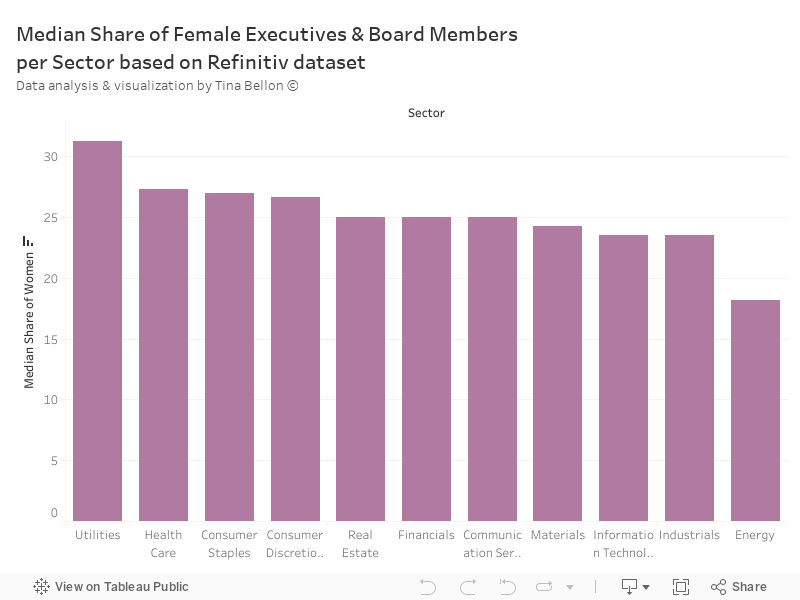
As the graph at the top shows, the gender distribution is roughly the same for both datasets (Sustainalytics and Refinitiv) - the median share of females as a percentage of overall board and executive seats is roughly 25%. (I’m using the median, rather than the average due to the skewed distribution)
Across both datasets, the share of women is also roughly the same across industries, with the highest share of women present in the utilities, healthcare and consumer sector, and lowest representation in the energy sector.
But a first indication that both providers potentially factor in gender diversity differently (remember, this is purely correlation, not causation, and both companies are somewhat murky about their precise methodology), is seen when graphing the ESG score distribution for different shares of female representation.
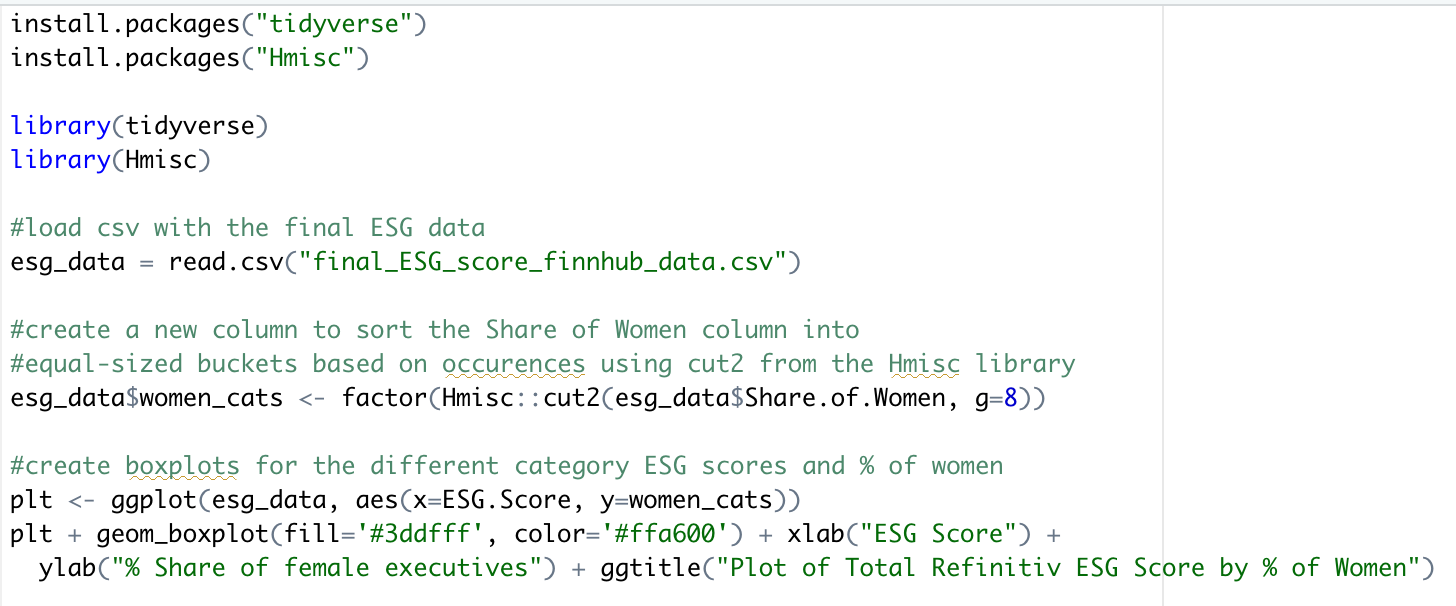
To do so, I sorted the share of women into different buckets, using R’s Hmisc library, which creates even-sized buckets according to the number of occurrences of data in each bucket.
For Refinitiv, the median ESG score slightly increases as the share of female leaders grows (up until around 30% of women):

For Sustainalytics, the share of women suggests no trend line when it comes to the distribution of ESG risk scores:

Next let’s make this data exploration more visually appealing, let’s map the share of women in leadership positions and the ESG scores in an interactive Tableau dashboard.
For Refinitiv:
For Sustainalytics:
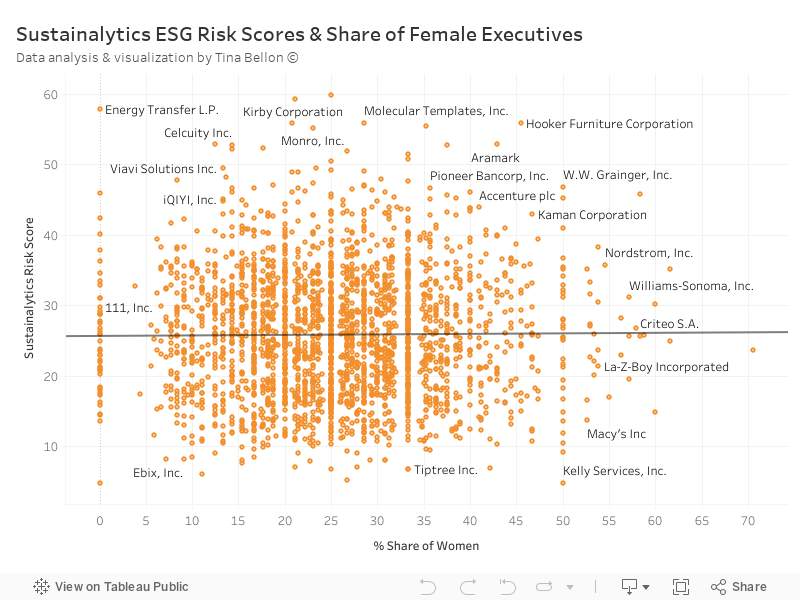
Tableau makes it easy to insert linear regression lines into data visualizations, and it becomes quickly apparent that there appears to be no correlation whatsoever between the share of women and the ESG Risk score for Sustainalytics.
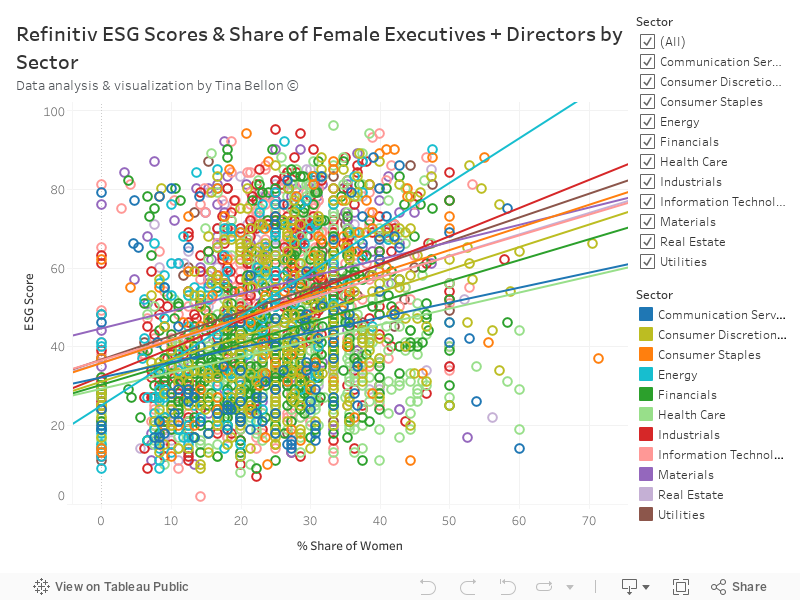
Perhaps there is a distinction when drilling down into specific sectors? Use the filter menu on the right (or on the top if you’re on mobile) to filter for different industry sectors and make the graph look less messy.
For Refinitiv:
For Sustainalytics:
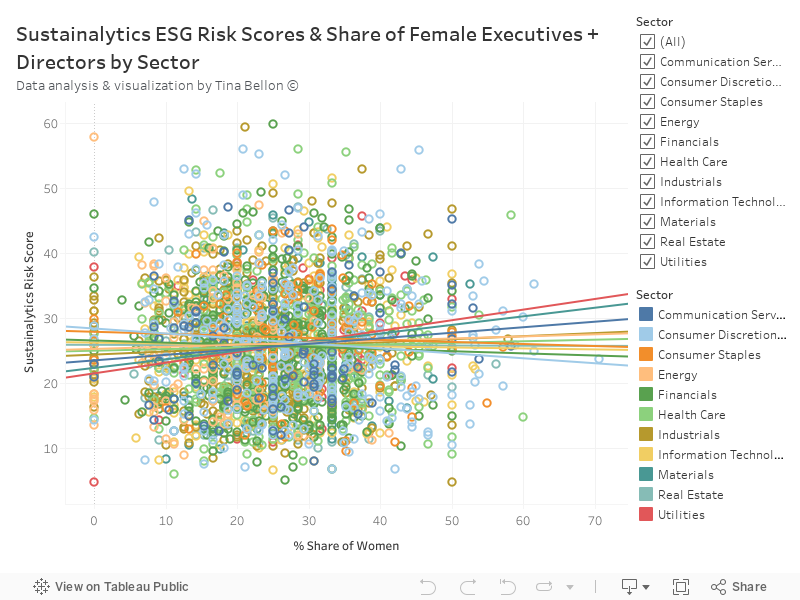
Again, a quick look at the Sustainalytics graphic seems to suggest that there also is no correlation between the share of women and ESG risk scores when filtering for different industries. The Refinitiv data on the other hand could show some correlation?
Is any of this statistically significant?
To explore the significance, I relied on RStudio to help me analyze linear and multi-linear correlation.
The first test I used, was to check the Pearson correlation coefficient to calculate the correlation strength. Generally speaking, the correlation coefficient’s significance, commonly described as r, is grouped as follows:
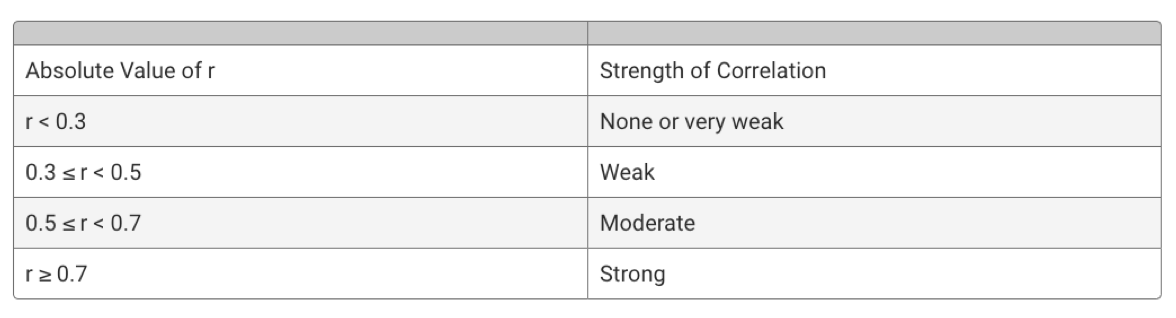
When looking at the Sustainalytics data, it will be no surprise that the coefficient shows no correlation:
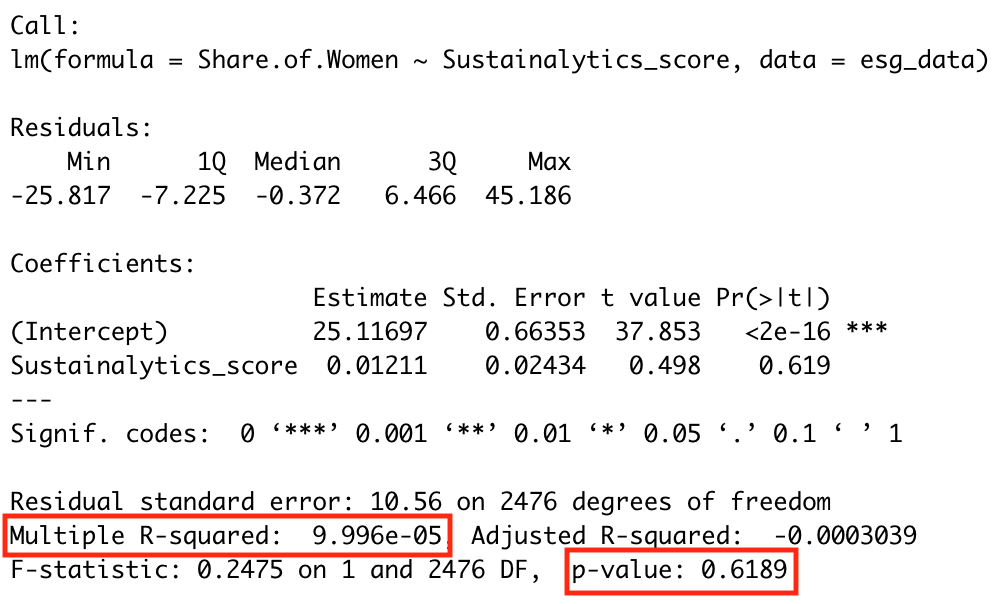
The value of r is as small as 0.00009432
Safe to say there’s no correlation
For the Refinitiv dataset, the coefficient is somewhat higher, but still shows no or very weak correlation between the share of women and the ESG score:
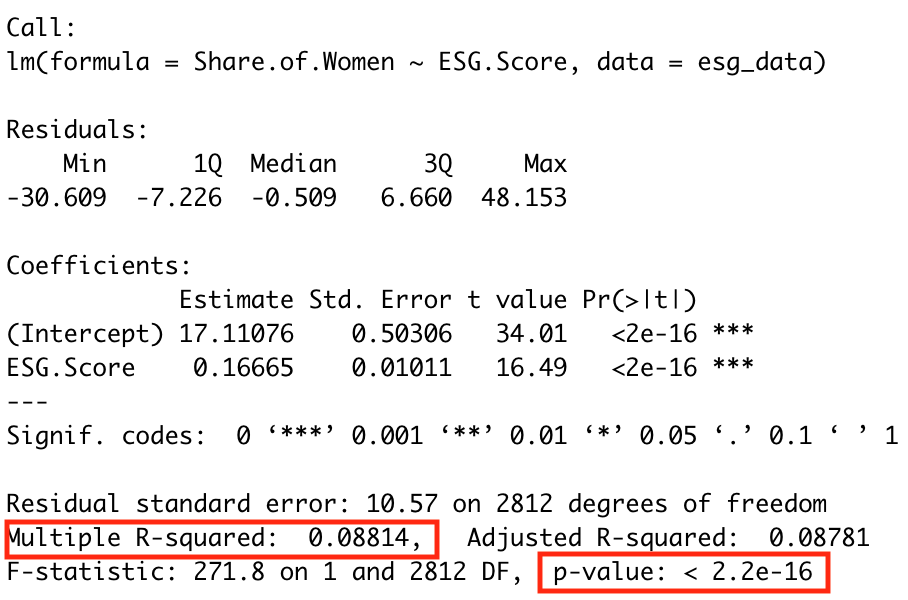
The rounded value of r is 0.09
Higher than in the Refinitiv dataset, but still showing no correlation
But unlike Sustainalytics, Refinitiv also provides ESG scores broken down by the three main categories: Environmental, Social and Governance.
Let’s first look at the median distribution of those scores per industry sector. Median scores differ vastly depending on the industry and the specific metric:
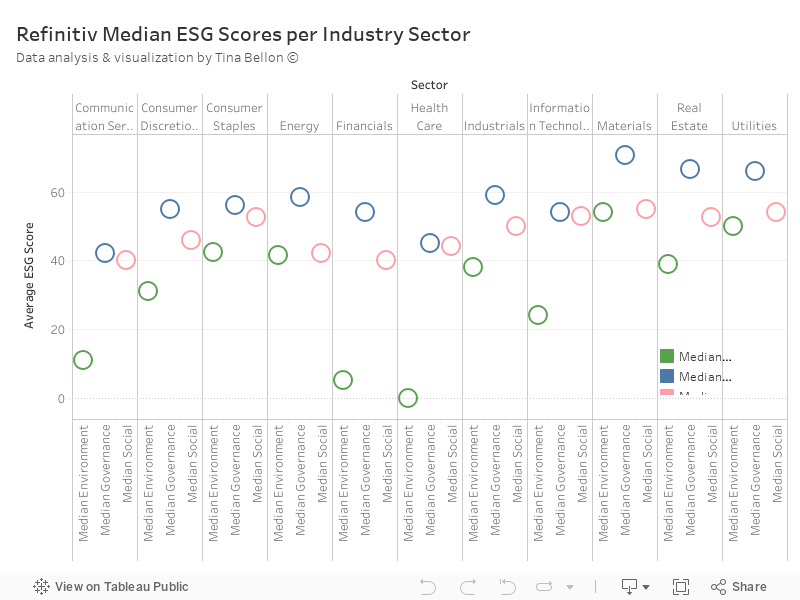
That suggests doing a multi-linear regression analysis in R to see if perhaps a specific category shows a higher correlation with the share of women per company.
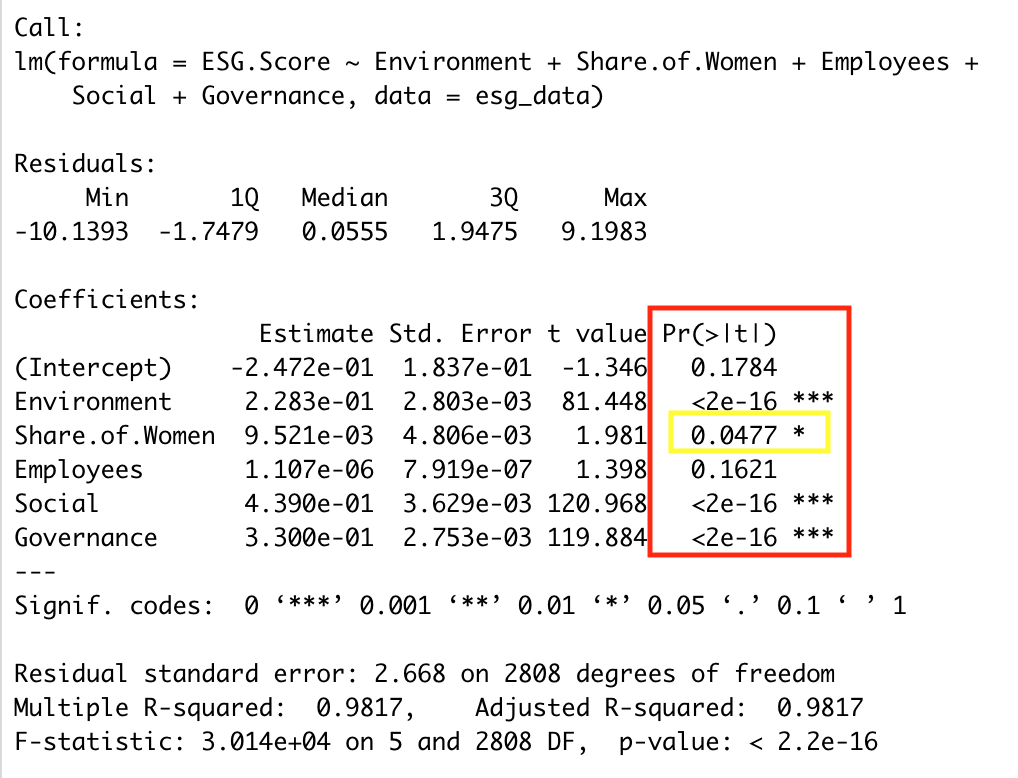
The p-value (Pr(>|t| in the coefficients table) denotes the probability of each coefficient contributing a random amount of variance to the linear model.
Assuming a significance level of 0.05, the Share of Women is just so below that threshold, meaning the variable has a slight impact on the dependent variable, the ESG score.
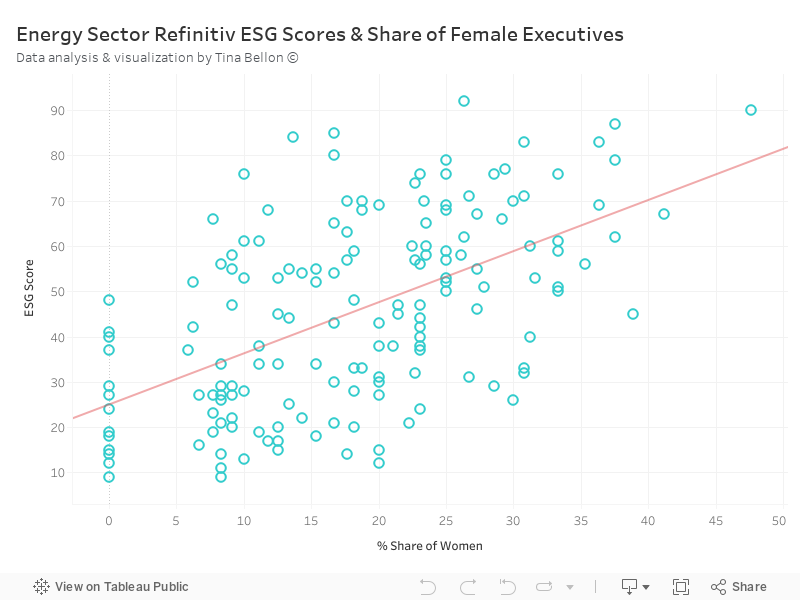
But unlike in the Sustainalytics dataset, the Refinitiv scores correlate differently with the share of women when filtering for different industry sectors. It turns out that one sector shows a very weak correlation (r = 0.3) between the percentage of women and the ESG score companies receive: energy!
So does the percentage of women in a senior leadership positions at a company correlate to higher ESG scores?
According to my analysis, the answer appears to be no, apart for a very weak correlation in the Refinitiv dataset for the energy sector.
What is striking, however, is how vastly different the results are for the two data providers, Refinitiv and Sustainalytics. Both companies are not entirely transparent in how they weigh and measure different risk scores, so it is hard to discern to whether and to which degree the share of women in senior leadership positions plays a role in determining the final score.
There are also four other data providers whose data is not publicly accessible, which prevented me from analyzing it. Given the vast difference in ESG scores between providers, the percentage of women might produce different correlation coefficients for other providers.
Project Summary:
You can find the entire code for this project in my GitHub repository. As discussed above, I started out with this dataset of around 7,000 listed companies across U.S. stock exchanges.
To get the corresponding ESG scores from Refinitiv, I had to enter the company names into the website search bar. It turned out, that the company names were saved in a different format on the Refinitiv website than in the spreadsheet. I did some regex to even them out:

I then launched my automated Chrome browser, and ran through the list of 7,000 company entries, each time making sure the input was cleared if the company was not found.

Once that code finished running (it took many hours), I did some basic pandas to transpose the dataframe and change some column formatting. The final dataframe, containing nearly 3,000 rows, looked like this:

The Sustainalytics website worked slightly differently. Instead of names, companies can also be found with their ticker symbol and the stock exchange abbreviation (for example NAS:TSLA) for Tesla Inc on Nasdaq.
That meant I started out changing the naming convention of the stock exchanges from the original data set:
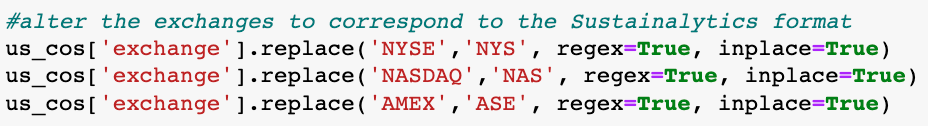
I then combined the exchange code with the ticker symbol to generate the same format as on the Sustainalytics site:

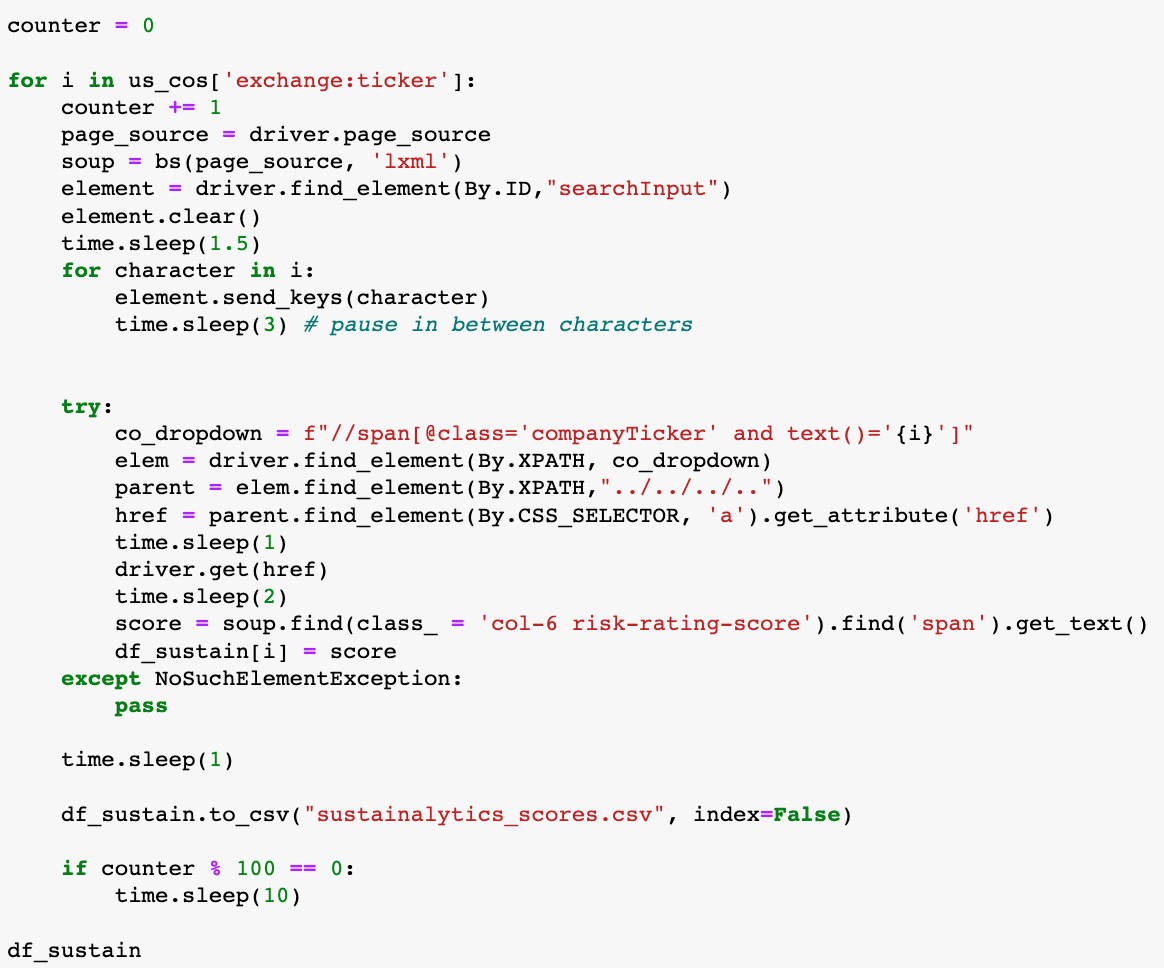
To sort through the website, I had to slow down the automated key entry option through Selenium. If the program typed the keys too fast, the Sustainalytics website did not respond quickly enough with a dropdown menu, which made it impossible to find the corresponding company:
I then had to request data for all the tickers through the Finnhub API. I requested the gender of the executive team and board members and calculated the share of women, I requested the annual revenue and calculated a running four-year average (which turned out to be useless as Finnhub didn’t have revenue data for a large amount of companies), and I requested the industry group and sector for each company:

I then merged the previous dataframes containing the ESG scores with the data from Finnhub on each company’s ticker symbol.
That data was then used to create some summary statistics and basic Matplotlib illustrations on the data distribution, and was used to calculate correlation in R. I also created the boxplots in R using ggplot and the Hmisc library mentioned above to group the share of women column:
The correlation and multi-linear regression stats were calculated using R’s summary(lm) function:
